![]()
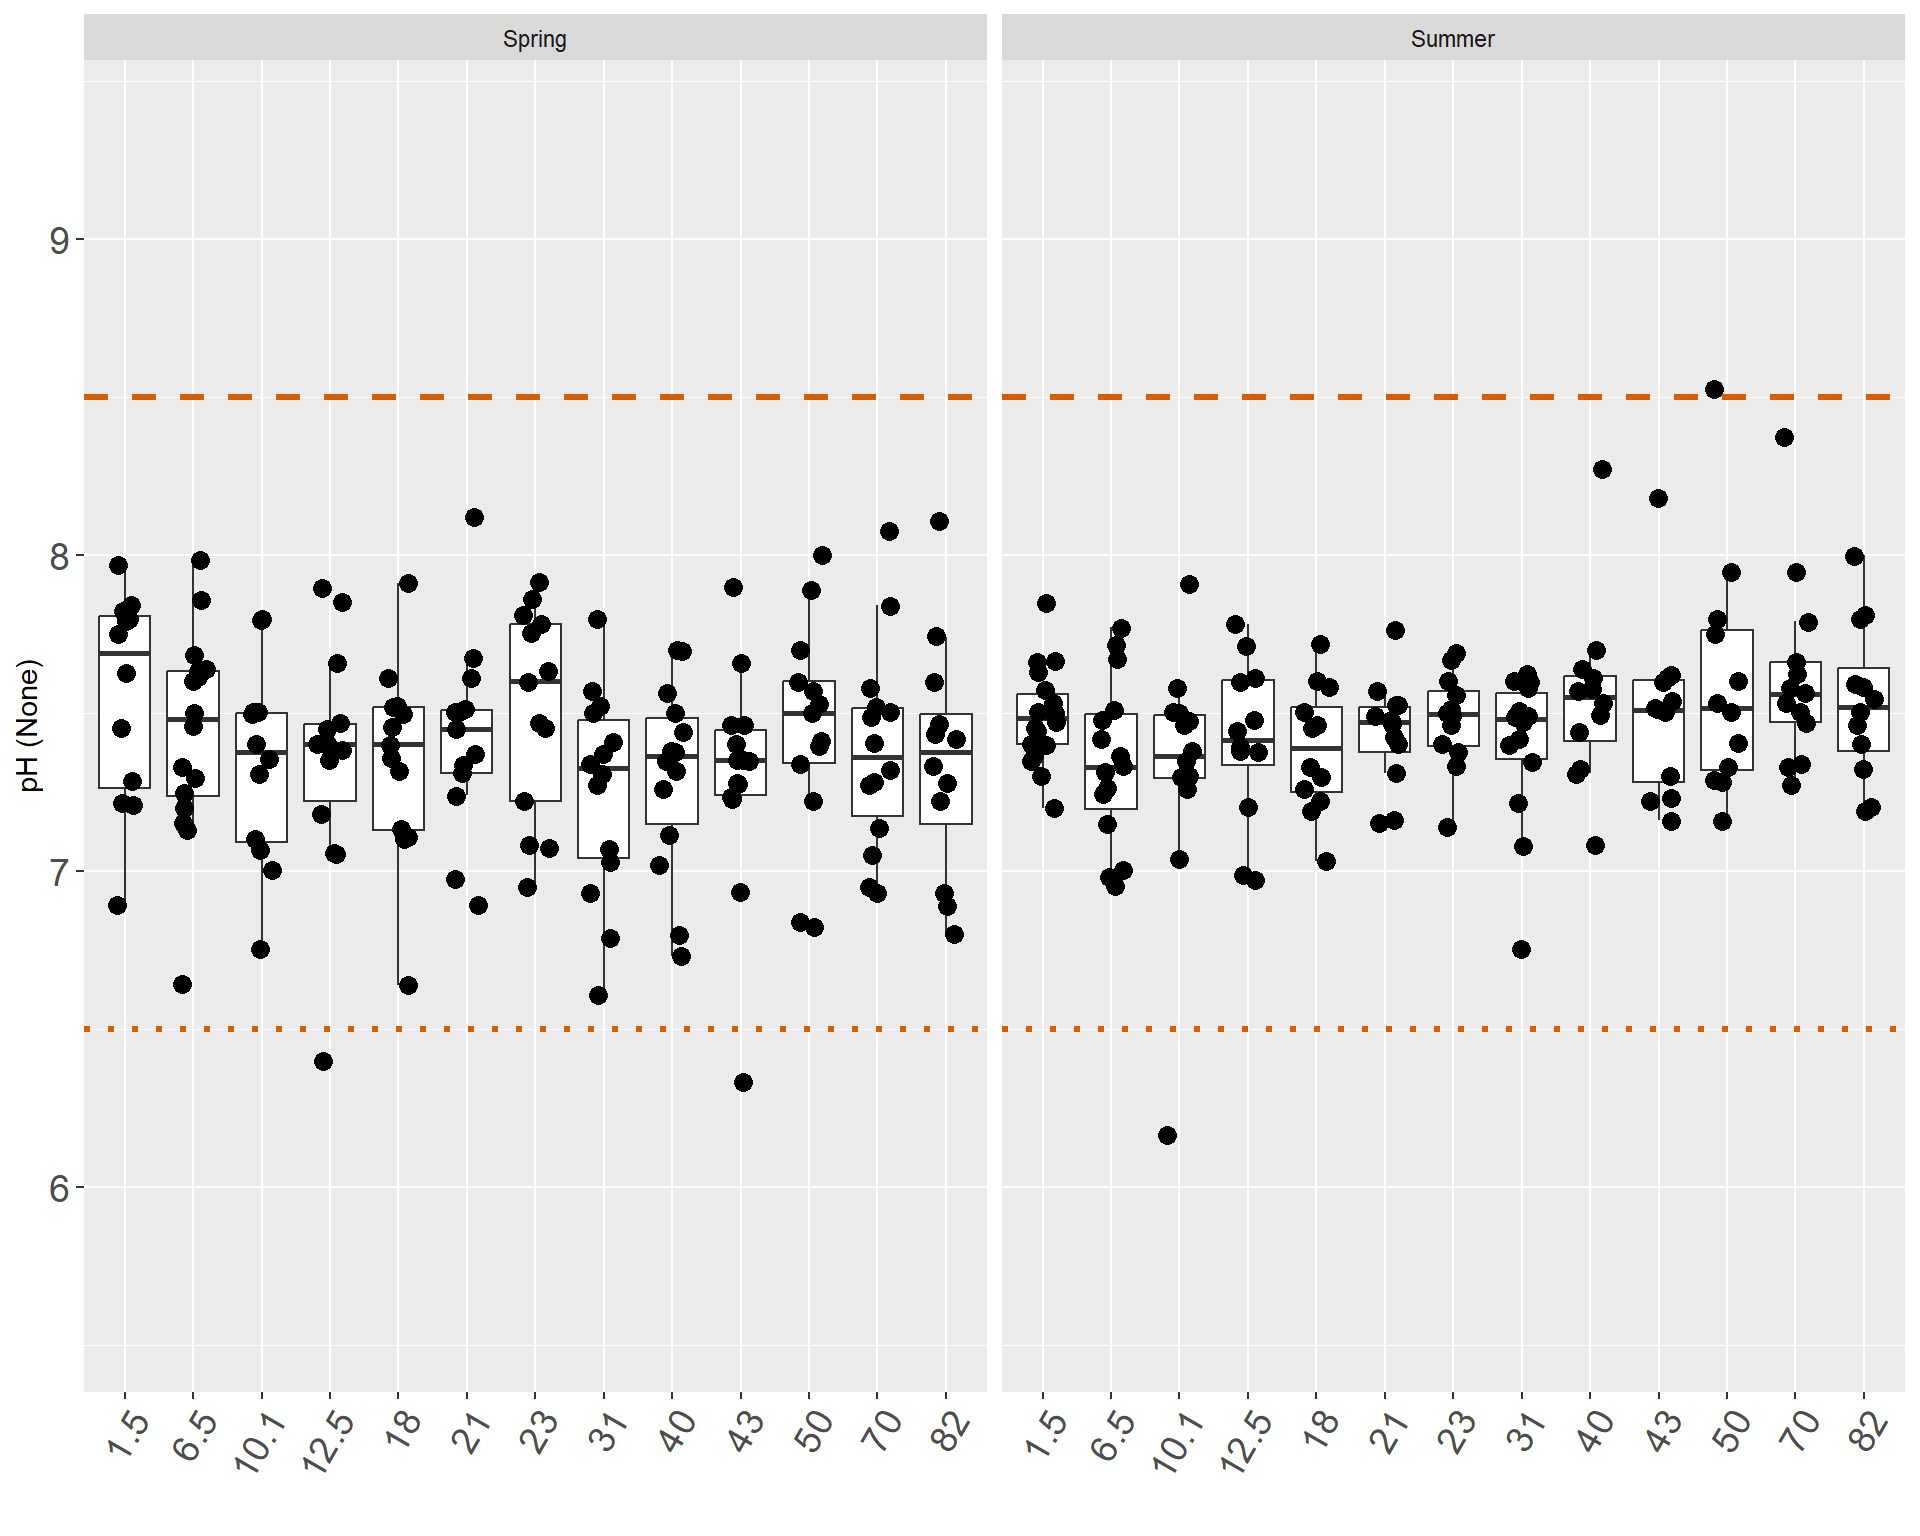
The concentration of hydrogen-ion activity is represented by a pH measurement on a logarithmic scale ranging from 0 to 14 with acidic conditions closer to 0 and alkaline conditions closer to 14 (Glass, 1999). Values of pH ranging from 6.5 to 8.0 are typical in unpolluted river water, and these values can be affected by both natural and human processes (Glass, 1999). The ADEC standard for pH maintains that freshwater may not have a pH less than 6.5 or greater than 8.5 for the growth and propagation of fish, shellfish, other aquatic life and wildlife (see Appendix 2) (ADEC, 2012). Additionally, the standard stipulates that the pH may not vary more than 0.5 pH units from natural conditions and that in any water with a pH naturally outside the specified range, variation of pH must be toward the specified range (ADEC, 2012).
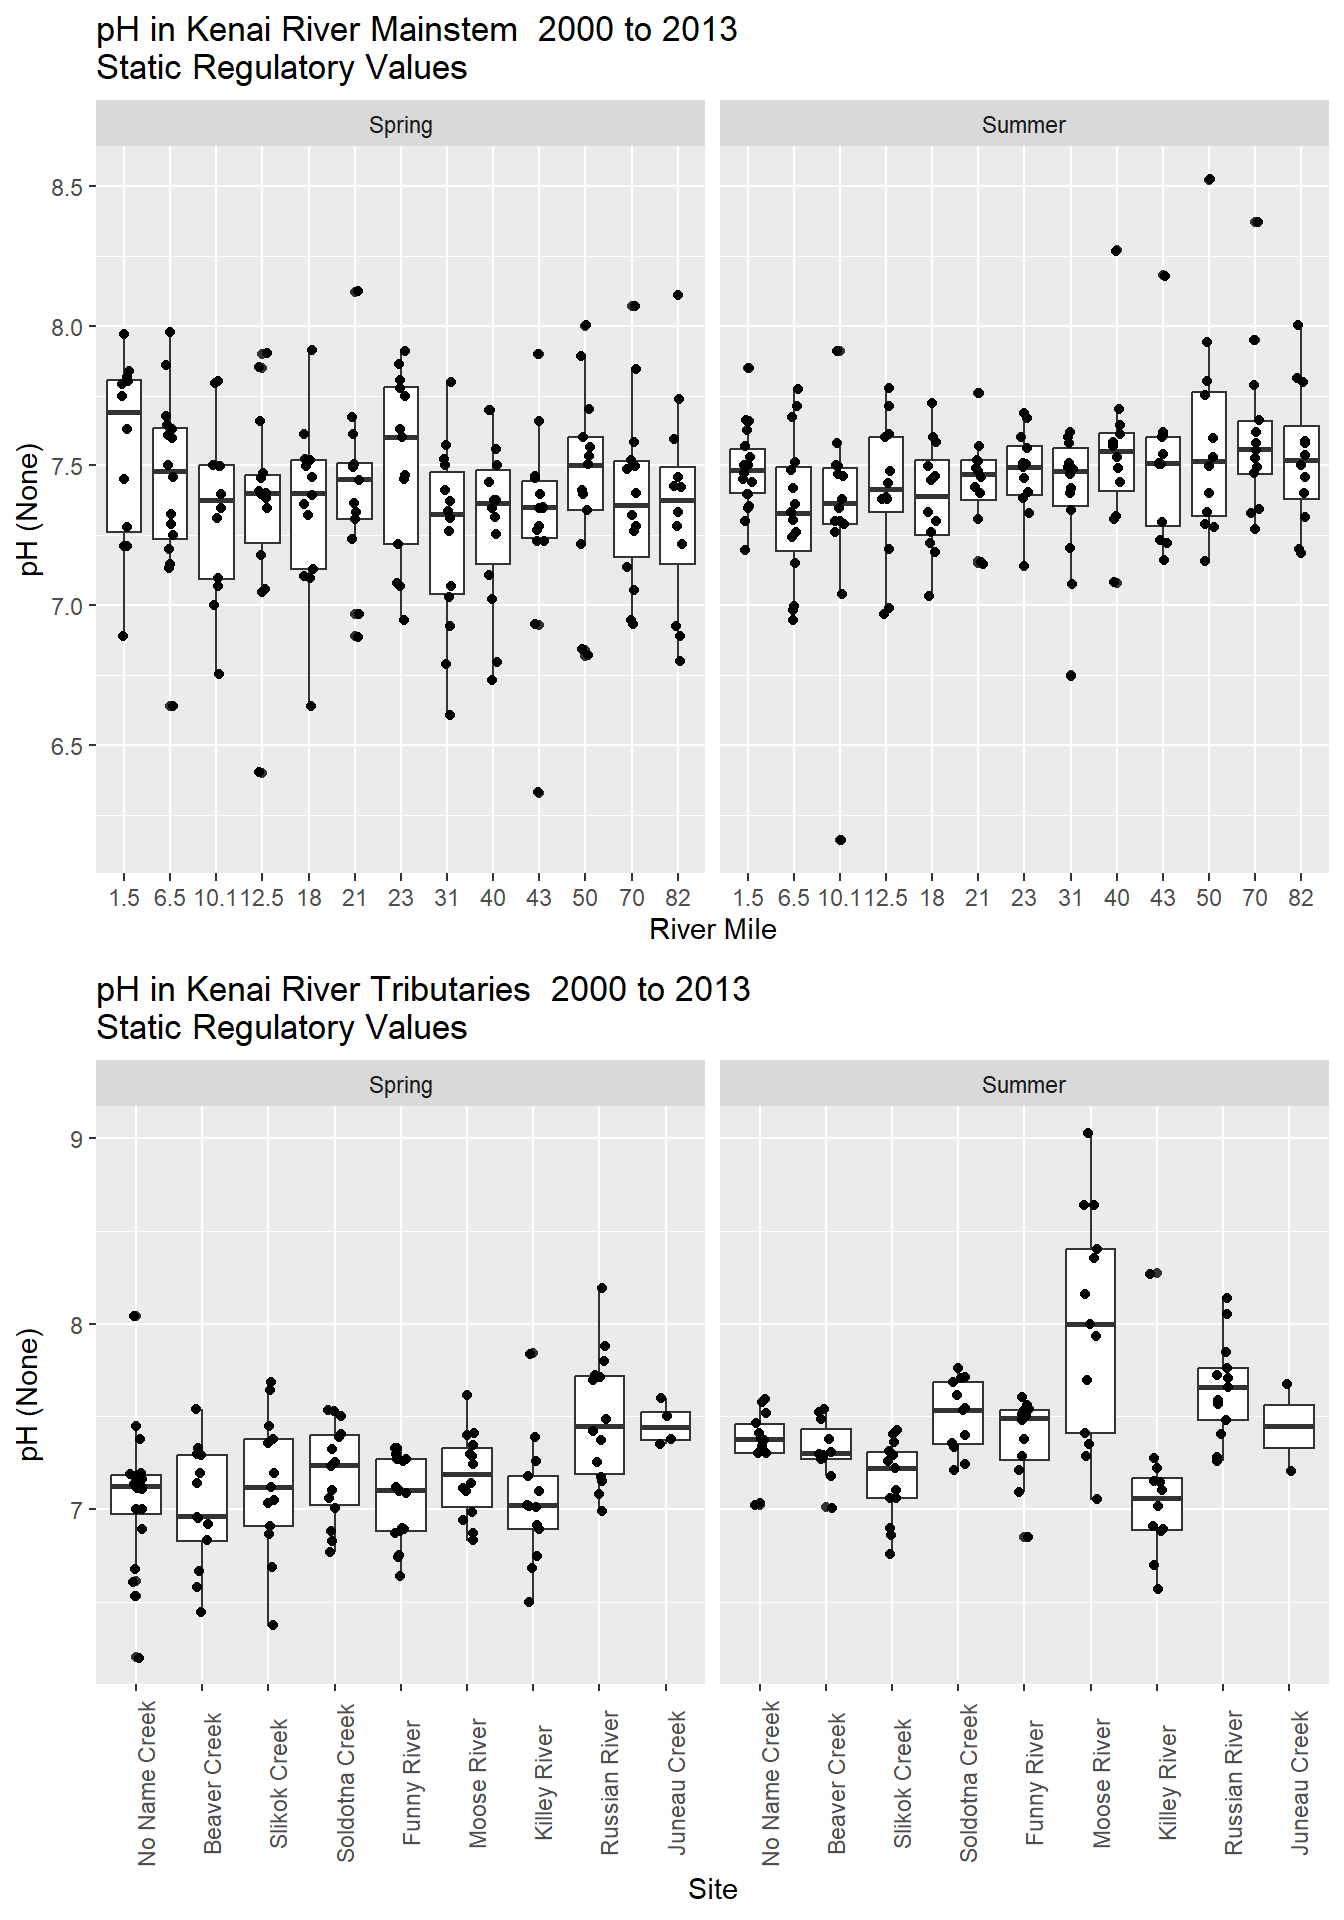
In the mainstem, the pH ranged from a high of 8.52 at Mile 50 in summer 2002 to a low of 6.16 at Mile 10.1 in summer of 2010 (Table 27). All the medians along the mainstem were between 7 and 8 for the spring and the summer, so they did not exceed the upper and lower limits. Individual samples exceeded the lower limit once at Mile 12.5 and Mile 43 in the spring and Mile 10.1 in the summer, and the upper limit was exceeded by a single sample at Mile 50 in the summer. The pH was generally lower in the spring in comparison to the summer in both the mainstem and the tributaries (Figures X & X).
The highest pH ever sampled was 9.03 at Moose River during summer 2002, and the lowest was 6.2 at No Name Creek in spring 2005 (Table 53). The medians of the tributaries did not exceed either the upper or lower pH limit. The lower limit was exceeded on one occasion each in No Name Creek, Beaver Creek, and Slikok Creek in the spring, and three samples from the Moose River exceeded the upper limit in the summer. The Moose River had the highest median pH in the summer, followed by the Russian River. From spring to the summer, the Killey River median remained near 7, while the other tributaries increased toward 7.5. Excluding the Moose River, the spring samples from the tributaries and the mainstem displayed greater variability than the summer samples (Figures X & X).