![]()
Metallic lead and lead minerals are not classified as soluble in water, but they can be solubilized by certain acids, and a selection of industrial lead compounds are water soluble upon production (USEPA, 1980b). Lead is a component in electroplating, metallurgy, construction materials, plastic, and electronic equipment, and it can enter surface water through precipitation, dust, street runoff, and wastewater discharges (USEPA, 1980b). Exposure to lead can cause delayed embryonic development, reduced growth, and suppressed reproduction in fish, and spinal deformities in rainbow trout fry (USEPA, 1980b). Determined by the ADEC and the USEPA, the standard for lead ranges from 0.300 to 10.94 μg/L, depending on hardness, for the chronic exposure of aquatic life in freshwater (Appendix X) (ADEC, 2008; USEPA, 2014).
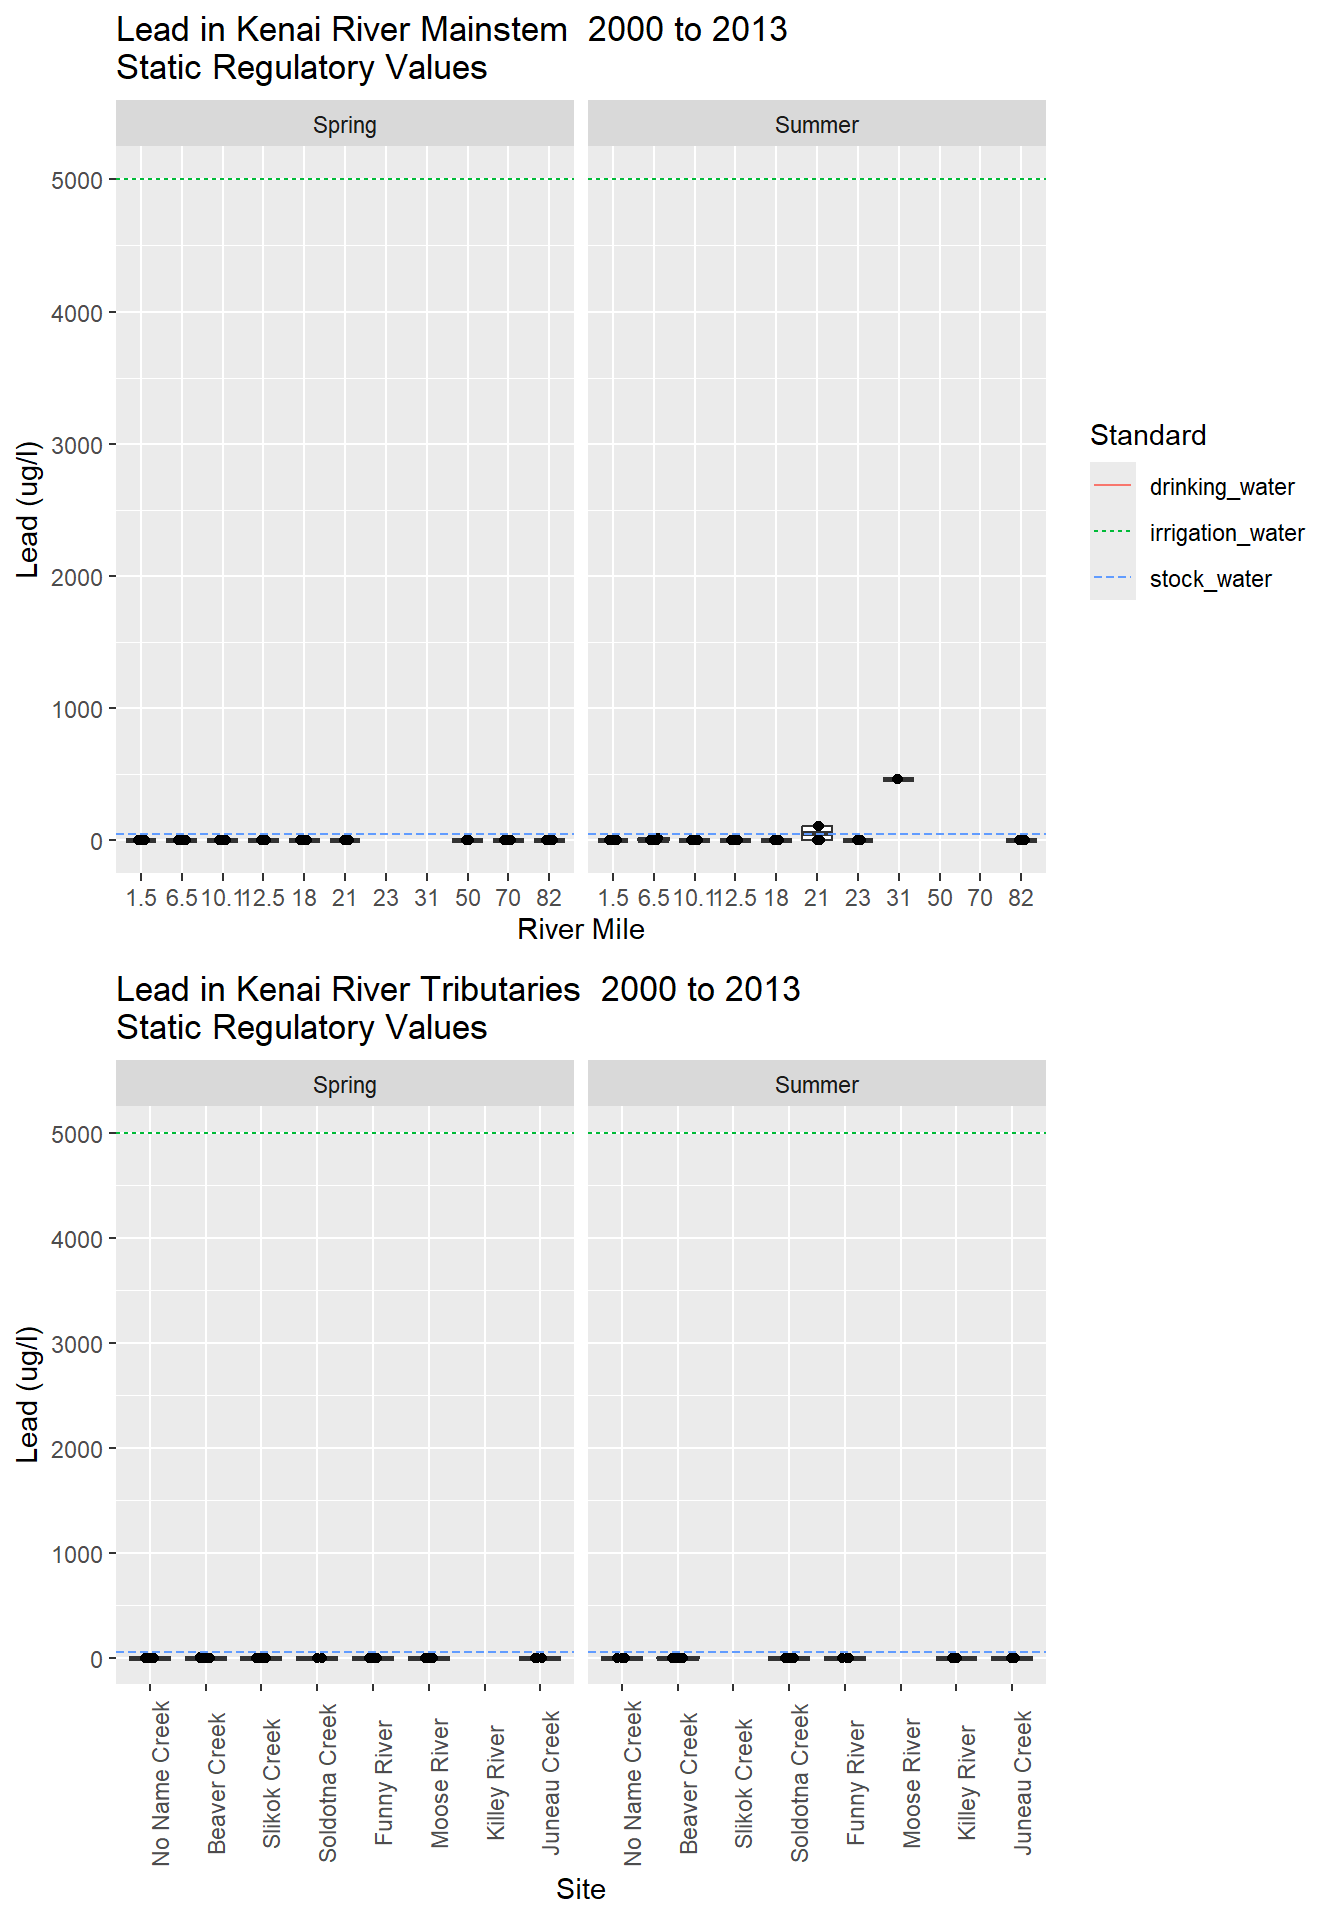
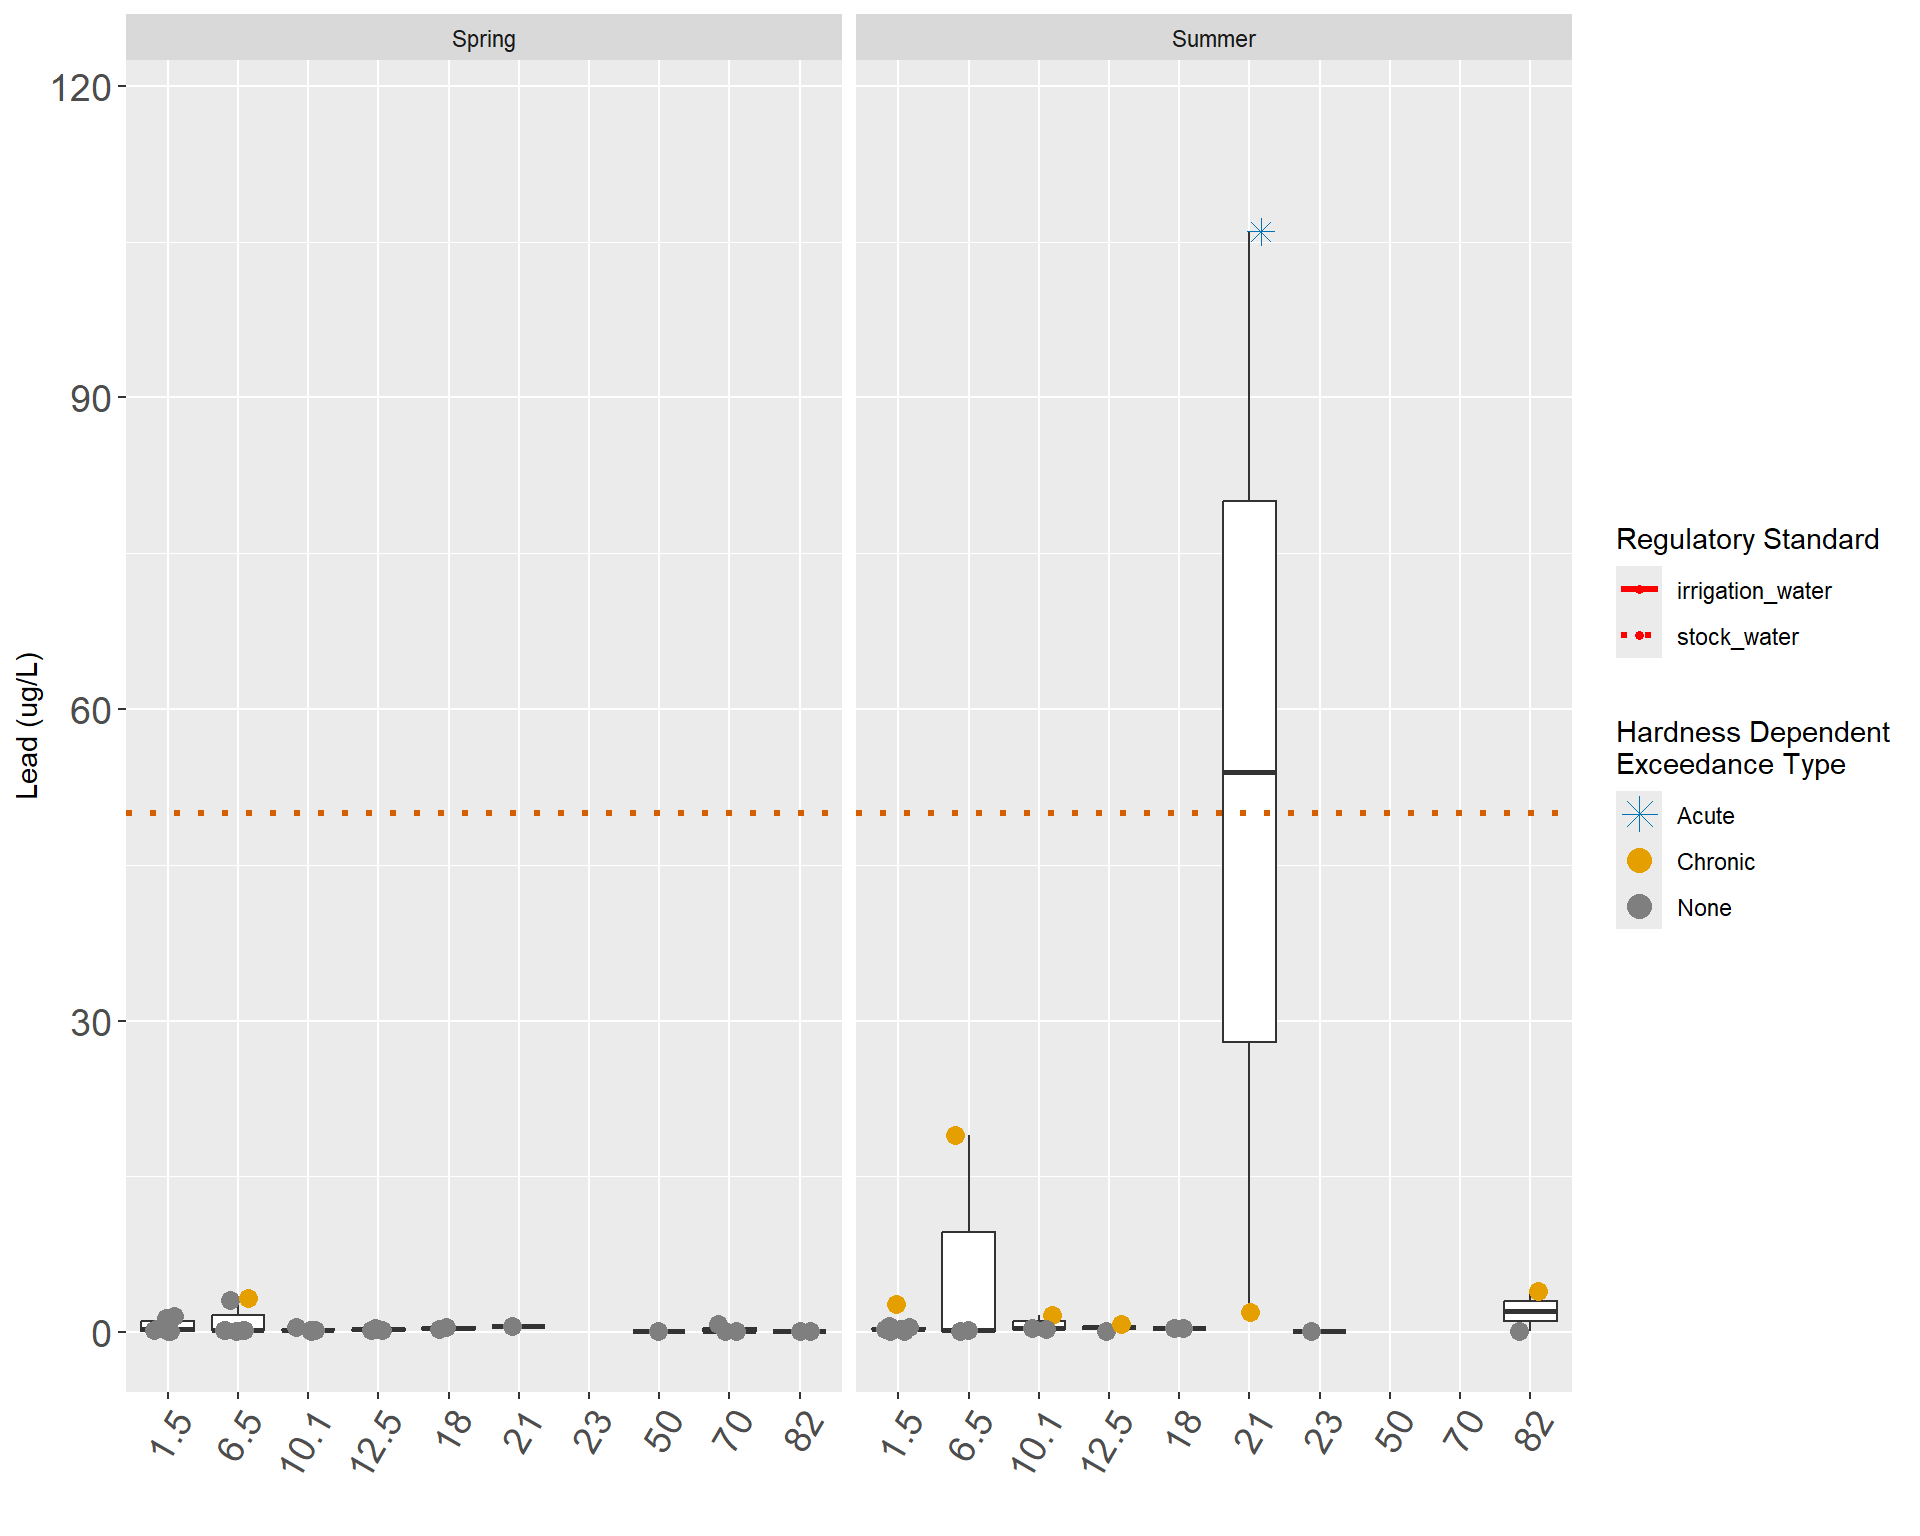
The highest concentration of lead in the mainstem was 468 μg/L and was sampled at Mile 31 during summer 2005, and the lowest levels occurred below the MDL of 0.030 μg/L at many locations in the spring and the summer of the sampling years. Exceedances occurred mainly in the summer, when lead exceeded the criteria twice at Mile 21, and once at Mile 1.5, Mile 6.5, Mile 10.1, Mile 12.5, Mile 31, and Mile 82, Mile 1.5 and Mile 6.5 exhibited the most instances of detection in the spring and the summer. At Mile 40, Mile 43 and Mile 74 (Russian River) no concentrations of lead were ever reported. Only two exceedances where recorded during the spring sampling events, once at Mile 6.5 and once at Mile 10 (Beaver Creek) (Table X).
The concentration of lead in the tributaries ranged from a high of 3.92 μg/L at Beaver Creek in summer 2006, and the lowest levels were below the MDL of 0.030 μg/L at many locations in the spring and summer sampling events. The Killey River and Juneau Creek each exceeded the criteria on one occasion in the summer of 2004 and 2013 respectively. Beaver Creek had two exceedances, one in the spring of 2011 and one in the summer of 2006. No lead was ever reported in Russian River. The MDLs were higher than the standard from summer 2000 through summer 2003 and summer 2005, so it is unknown whether exceedances occurred in many of these samples (Table X).
A trend analysis was conducted using the average and median values for all data collected during the time period between years 2000-2014. The concentrations of lead throughout the entire Kenai River are relatively high in the lower river and decrease as you move towards the upper river (Figure X and Figure X). A similar analysis was done for each sampling station at the Kenai River with results showing that no lead was found in most of the sampling stations before year 2005, after year 2005 when lead has been found it shows a decrease in concentration through time. It is important to note that not every station has an actual reading and in many cases there are very few readings or non- at all.