3 Thermal Imagery Data
3.1 Introduction
To acquire and prepare thermal aerial infrared imagery, we worked with NV5 Geospatial1 (formerly Watershed Sciences, Inc), a contractor who has led prior efforts in the region to gather thermal aerial infrared data for aquatic habitat research (Watershed Sciences 2010). On July 5, 2020, NV5 collected thermal infrared imagery from a helicopter-mounted camera for the four steams on the Kenai Peninsula lowlands that were the focus of this study (Beaver Creek, Funny River, Moose River, and Crooked Creek). All streams were flown during the afternoon hours in order to maximize the thermal contrast between the river’s water and the banks.
The surveys extend for a total length of 59.1 km of the streams. Flight transects proceeded from the mouth of each stream in an upstream direction. The data were collected to aid the team in identifying the spatial variability in surface temperatures as well as thermal influence of point sources, tributaries, and surface springs.
Specific deliverables generated by NV5 Geospatial from the thermal imagery data include:
Rasters (map image files; .tif and .jpg formats)
Shapefiles (longitudinal temperature profiles, stream centerlines, others; .shp format)
Other supplemental items (coordinates of significant thermal features, maps and figures, and others)
The full technical report from NV5 Geospatial describes detailed methods and interpretation of aerial thermal infrared imagery. In the online version of this document2, the NV5 report can be downloaded at the below.
The image raster files are of a large size (~3 GB) and may be acquired by contacting staff involved with this project:
Cook Inletkeeper (sue@inletkeeper.org)
Kenai Watershed Forum (hydrology@kenaiwatershed.org)
Kachemak Heritage Land Trust (info@kachemaklandtrust.org).
3.2 Parcel data summary
We generated a table in GIS (ArcMap Pro 10.8.1) of parcels in the Kenai Peninsula Borough that intersect with cold-water inputs (e.g. seeps, springs) within the surveyed areas of Beaver Creek, Crooked Creek, Moose River, and Funny River. We identified a total of n = 31 unique parcels containing a total of n = 63 unique cold water refugia features.
Figure 3.1 below summarizes the ownership type of these parcels by general category of owner type.
3.3 Ground truth data
On July 7-8, 2021, we visited a subset of sites identified by the NV5 Geospatial report as cold-water features. We visited 12 of 63 total sites. We recorded surface water temperatures of the identified features as well as the adjacent main stem using a Hach Sension 5 portable meter. The average time difference between main stem temperature observation and off-channel observation was 13.9 minutes. We created a graphic sketch of the layout of each feature, and recorded site photos.
In the online version of this document3, field forms, including site sketches, can be accessed at the download link below.
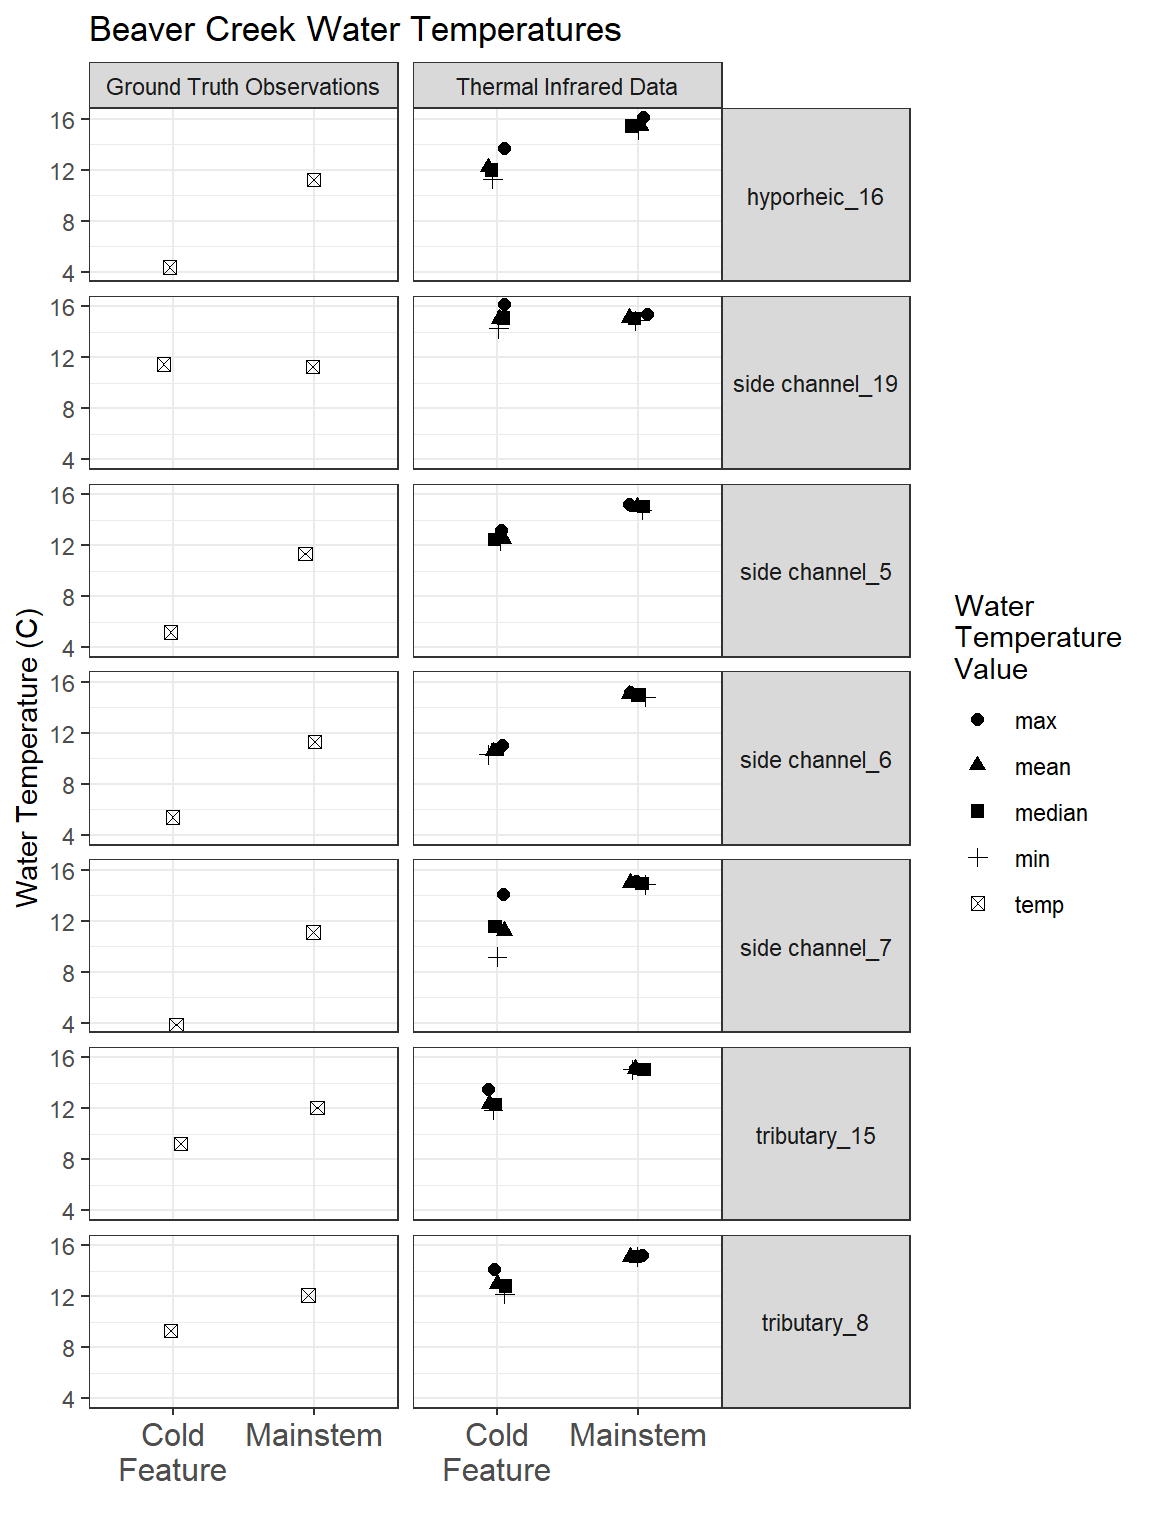
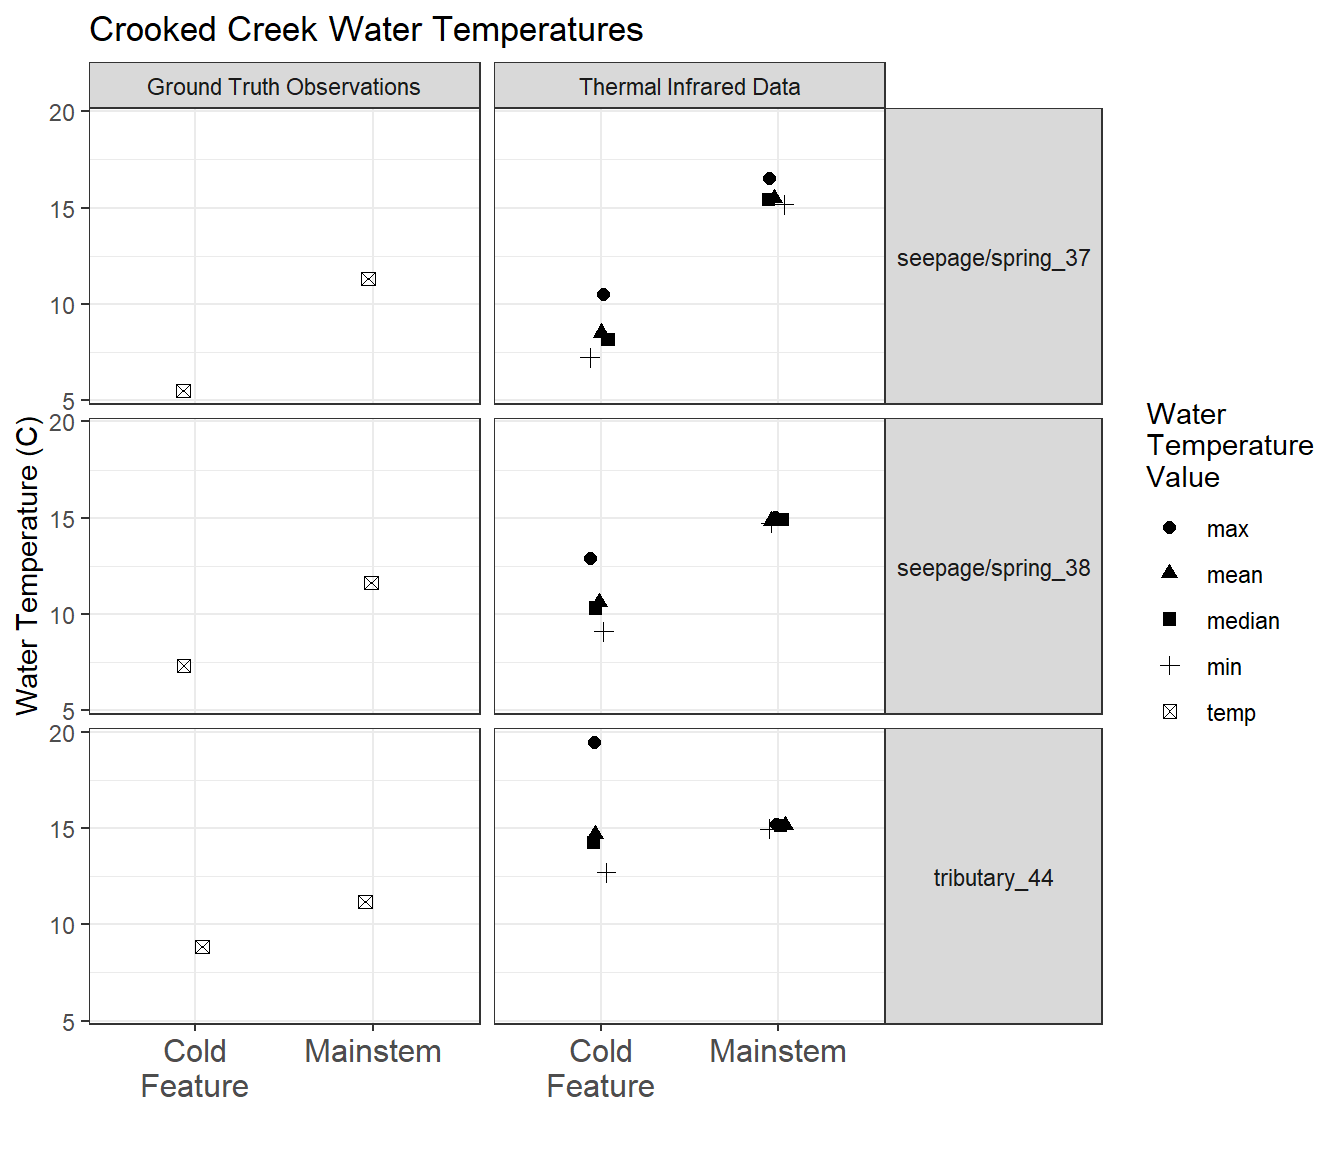
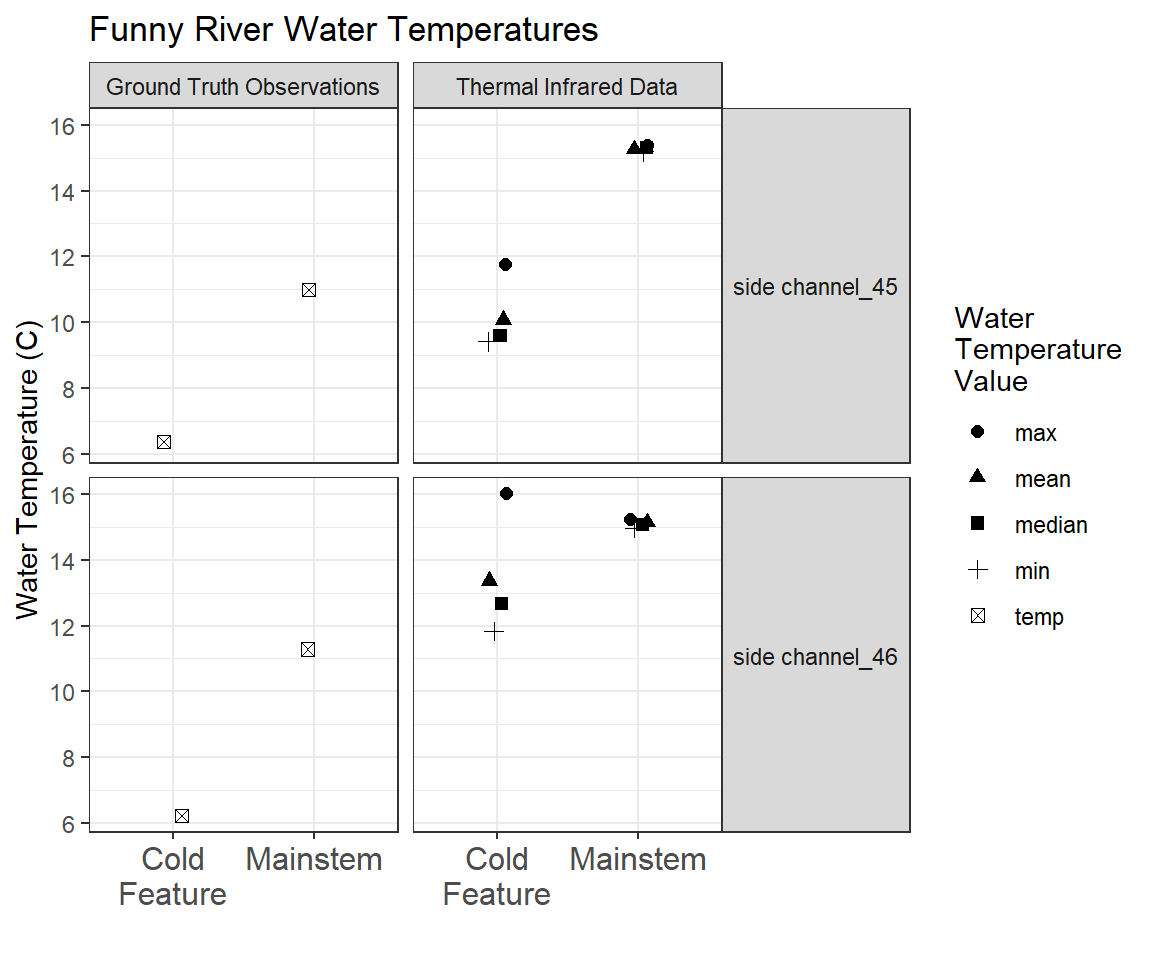
In general, we observed symmetry in the pattern of temperature contrast for both our ground-truthed data as well as temperatures observed from the thermal aerial infrared dataset. This indicates that the temperature contrasts identified from the aerial imagery are persistent and not ephemeral.
Figure 3.2 through Figure 3.4 visualize water temperature data sourced from the significant features in aerial imagery on July 20, 2020 along with ground-truthed measurements from July 7-8, 2021.
Note that the temperature data reported from thermal infrared imagery observations consists of multiple statistics, whereas the ground-truth values consist of a single observation. Multiple statistics are reported for the aerial thermal infrared temperature values as a result of the sampling method used, wherein ten surface temperatures within a two-meter radius are evaluated. See the, “Interpretation and Sampling” section in the technical report from NV5 Geospatial, available for download above (NV5 Geospatial 2021).
3.4 Collaborative Assessment
Researchers with participating organizations assessed conservation strategies within each study watershed and recorded their notes on a shared platform. These collective notes are being used internally to inform strategy for outreach approaches with local property owners.
Data sources used to assess parcel-specific conservation strategies include:
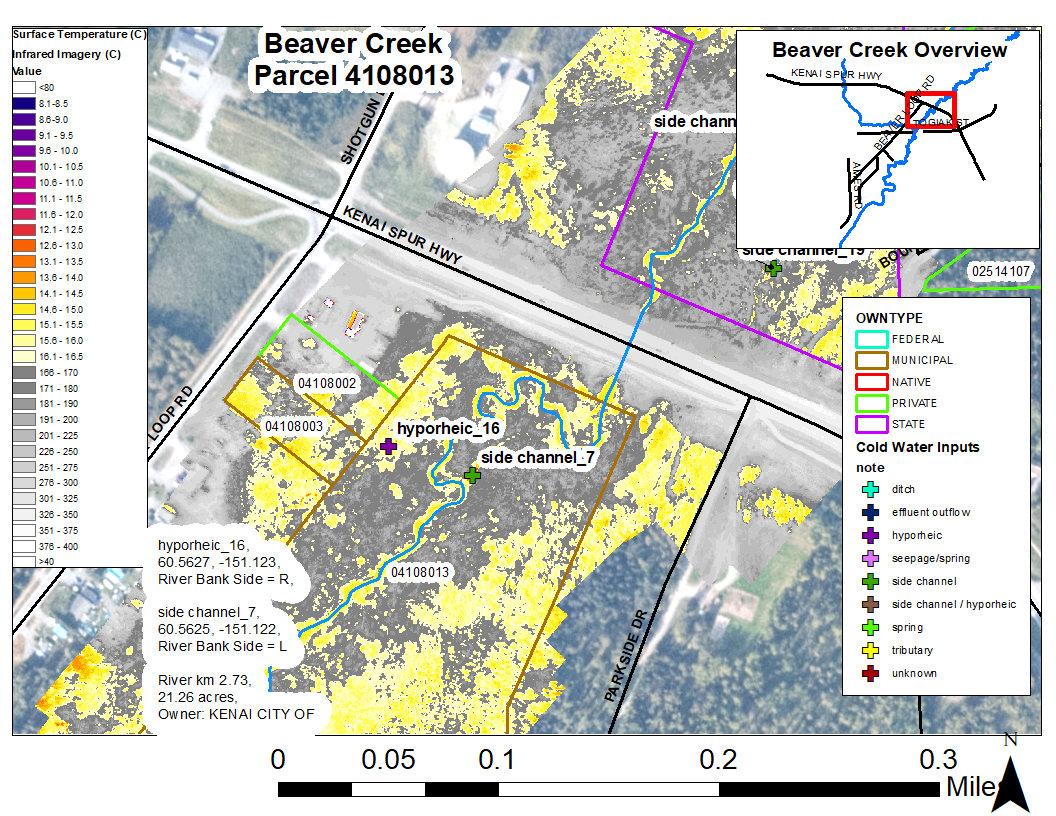
Custom maps for each significant thermal feature, including information about the parcel or parcels that it occupies
Information about individual thermal features from the NV5 Geospatial Report, including mean value and contrast with the main stem
In the online version of this document, project collaborators may access the Thermal Imagery Database Google Sheet using the link below:
Link: Thermal Imagery Collaborative Assessment
An example map is shown in Figure 3.5.
https://www.nv5.com/geospatial/↩︎
https://kenai-watershed-forum.github.io/kenai_thermal_imagery_v2/↩︎
https://kenai-watershed-forum.github.io/kenai_thermal_imagery_v2/↩︎